Current Inflation Rate
3.40%
Trailing 12-month CPI
3.40%
Trailing 12-month CPI
Current CPI
334.980
Bureau of Labor Statistics, projected
334.980
Bureau of Labor Statistics, projected
Annual Inflation (2025)
2.76%
Bureau of Labor Statistics
2.76%
Bureau of Labor Statistics
Use our Inflation Calculator
Updated: September 11, 2026This inflation calculator uses official records published by the U.S. Department of Labor. Inflation has averaged 0.95% per year since 1635, causing an overall price difference of 3,935.90%.
Use the form on this page to look up inflation for any year (this year's inflation is estimated based on latest monthly CPI data).
About Inflation
What is inflation? Inflation is a measure of how prices change over time. The U.S. Bureau of Labor Statistics (a part of the U.S. Department of Labor) selects a "basket of goods," which is a collection of many goods and services that are commonly used by consumers. Every month, the prices of these goods are measured and compared to previous prices.
Use the inflation calculator form as a starting point for answering questions that you have about the historical inflation rate in the U.S. This calculator allows you to "correct for inflation". You can also learn about inflation for the UK, Canada, Australia, and Europe.
Compared to last year's annual rate, the inflation rate in 2026 is now 3.40%. If this number holds, $100 today would be equivalent to $103.40 next year.
Go to the current inflation page for a more detailed, month-to-month view of official inflation rates, or test assumptions to predict future inflation.
| Cumulative price change | 3,935.90% |
| Average inflation rate | 0.95% |
| Price difference ($100 base) | $3,935.90 |
| CPI in 1635 | 8.3 |
| CPI in 2026 | 334.98 |
Note that CPI data prior to 1913 is estimated by Dr. Robert Sahr of Oregon State University and the American Antiquarian Society.
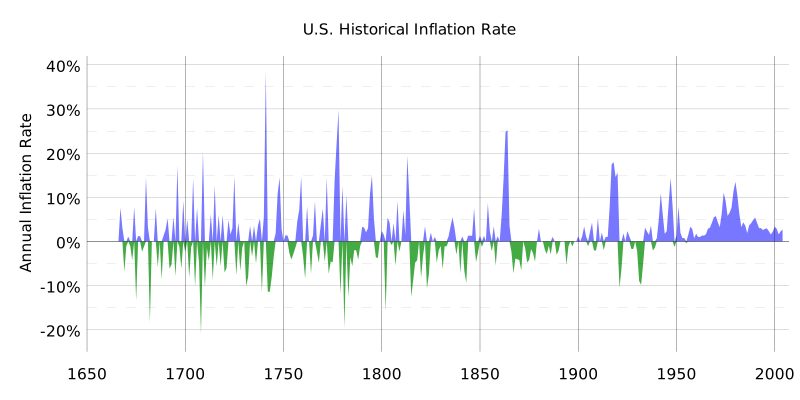
You may also be interested in inflation since 2000 or inflation since 1950.
Inflation by Spending Category
Every item in the Consumer Price Index "basket of goods" is categorized into spending categories. There are 8 major categories (food, housing, apparel, transportation, medical care, recreation, education, and other), and over 200 subcategories.
In the past year, the biggest mover is Transportation, which changed by 4.76%. This is followed by Other goods and services (3.97%), Apparel (3.29%), and finally Housing (2.90%).
Transportation has averaged 3.35% inflation since 1935. Other goods and services, Apparel, and Housing averaged 4.94%, 1.99%, and 4.24% respectively since they were first recorded.
In summary:
- Transportation: 4.76% (avg. 3.35% between 1935 and 2026)
- Other goods and services: 3.97% (avg. 4.94% between 1967 and 2026)
- Apparel: 3.29% (avg. 1.99% between 1914 and 2026)
- Housing: 2.90% (avg. 4.24% between 1967 and 2026)
Note that category changes will appear as "-100%" if data for this year has not yet been released.
Inflation by City (1990–2026)
Inflation can vary widely by city, even within the United States. Here's how purchasing power in some major cities changed between 1990 and 2026:
- Seattle, Washington: 3.56% average rate, $100 → $351.91, cumulative change of 251.91%
- Miami-Fort Lauderdale, Florida: 2.97% average rate, $100 → $287.16, cumulative change of 187.16%
- Atlanta, Georgia: 2.96% average rate, $100 → $286.26, cumulative change of 186.26%
- San Francisco, California: 2.88% average rate, $100 → $277.68, cumulative change of 177.68%
- New York: 2.67% average rate, $100 → $258.65, cumulative change of 158.65%
- Boston, Massachusetts: 2.64% average rate, $100 → $255.23, cumulative change of 155.23%
- Philadelphia, Pennsylvania: 2.55% average rate, $100 → $247.91, cumulative change of 147.91%
- Dallas-Fort Worth, Texas: 2.55% average rate, $100 → $247.72, cumulative change of 147.72%
- Detroit, Michigan: 2.45% average rate, $100 → $238.62, cumulative change of 138.62%
- Houston, Texas: 2.39% average rate, $100 → $234.19, cumulative change of 134.19%
- Chicago, Illinois: 2.39% average rate, $100 → $234.04, cumulative change of 134.04%
- St Louis, Missouri: 2.37% average rate, $100 → $232.57, cumulative change of 132.57%
Seattle, Washington experienced the highest average inflation rate among these cities, 3.56%, during the 36 years between 1990 and 2026.
St Louis, Missouri experienced the lowest average inflation rate among these cities, 2.37%.
Cities without enough data for this period are omitted. Click a city to see the calculation for the same dates.
Inflation by Country (1990–2026)
In the U.K., £100.00 in 1990 would be equivalent to £295.04 in 2026, an absolute change of £195.04 and a cumulative change of 195.04%. See the U.K. inflation calculation.
In Canada, CA$100.00 in 1990 would be equivalent to CA$211.08 in 2026, an absolute change of CA$111.08 and a cumulative change of 111.08%. See the Canada inflation calculation.
Compare these rates to the U.S. overall absolute change of $156.30 and total percent change of 156.30% over the same period.
We also track rates for other countries:
- Inflation in Europe: how the Euro tracks across 37 countries
- Inflation in Australia: inflation down under
- Inflation in Venezuela: a recent example of runaway hyperinflation
The Consumer Price Index
The result of the Bureau of Labor Statistics' monthly "basket of goods" measurement is a single number known as the Consumer Price Index (CPI). This the weighted average of many changes in the price of goods and services.
Inflation is quantified as a rate because it is a measure of how the CPI changes over time. When you see an inflation rate, the number is based on change in CPI between two points in time.
It's important to know which dates are being compared in order to understand the inflation rate. In most cases, inflation rates are 12-month trailing. This means, for example, that the inflation rate released in March 2026 is based on a comparison to the CPI in March 2025. If the inflation rate is annual, then it's based on the year-over-year CPI.
Select one of the options below to explore the basket of goods, or view the U.S. CPI over time.
Purchasing Power
The concept of "purchasing power" is used to compare the value of a dollar between different years. The Consumer Price Index directly measures purchasing power by keeping track of how many dollars it takes to buy common goods and services.
For example, if an apple costs $0.50 last year and $1.00 today, we can say that "the purchasing power of a dollar has decreased," because a dollar now buys you 1 apple instead of 2 (you can view actual inflation rates for apples and many other items).
Inflation is linked to purchasing power. As inflation takes place, the purchasing power of the dollar decreases. If deflation takes place, the purchasing power of the dollar increases.
Example: Calculate the Inflation Rate for $100 since 2000
This inflation calculator uses the following inflation rate formula:
CPI in 2020CPI in 2000
×
2000 USD value
=
2020 USD value
Then plug in historical CPI values. The U.S. CPI was 172.2 in the year 2000 and 257.208 in 2020:
257.208172.2
×
$100
=
$149.37
$100 in 2000 has the same "purchasing power" or "buying power" as $149.37 in 2020.
To get the total inflation rate for the 20 years between 2000 and 2020, we use the following formula:
CPI in 2020 - CPI in 2000CPI in 2000
×
100
=
Cumulative inflation rate (20 years)
Plugging in the values to this equation, we get:
257.208 - 172.2172.2
×
100
=
49.37%
Data source & citation
Raw data for these calculations comes from the Bureau of Labor Statistics' Consumer Price Index (CPI), established in 1913. Price index data from 1774 to 1912 is sourced from a historical study conducted by political science professor Robert Sahr at Oregon State University and from the American Antiquarian Society. Price index data from 1634 to 1773 is from the American Antiquarian Society, using British pound equivalents.
You may use the following MLA citation for this page: “Inflation Calculator.” U.S. Official Inflation Data, Alioth Finance, 3 Oct. 2026, https://www.officialdata.org/?trk=public_profile__reactions-text.
in2013dollars.com is a reference website maintained by the Official Data Foundation.

| Cumulative price change | 3,935.90% |
| Average inflation rate | 0.95% |
|
Converted amount
$100 base | $4,035.90 |
|
Price difference
$100 base | $3,935.90 |
| CPI in 1635 | 8.300 |
| CPI in 2026 | 334.980 |
| Inflation in 1635 | 0.00% |
| Inflation in 2026 | 3.40% |
| $100 in 1635 | $4,035.90 in 2026 |